Orders charts
T1 provides the Charts feature which enables you to create charts and analyse your orders based on certain order fields such as customer code, quantity, location, creation date, etc. These charts can be created based on the count of orders having a certain field or based on the summation of values for a numeric field.
To view charts, follow these steps:
- Select the catalog you want then click Orders from the left side menu, the following page appears:
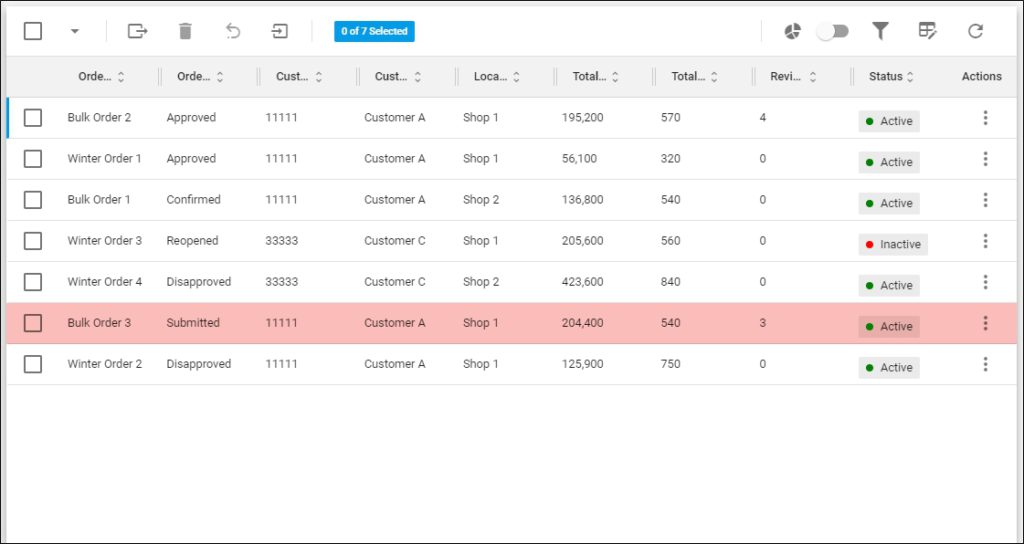
The above orders are displayed in list view, for each order the order reference, order processing status, customer code, customer name, location name, total current value, total quantity, revision, and status are displayed depending on the columns you have chosen to show using the Column chooser.
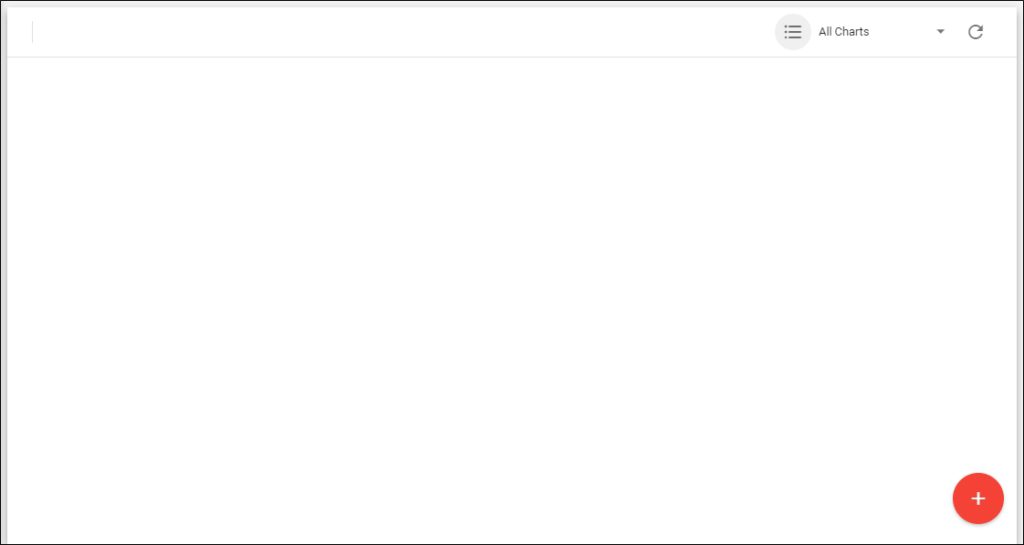
- Click the Charts button, the following page appears if no charts are available:
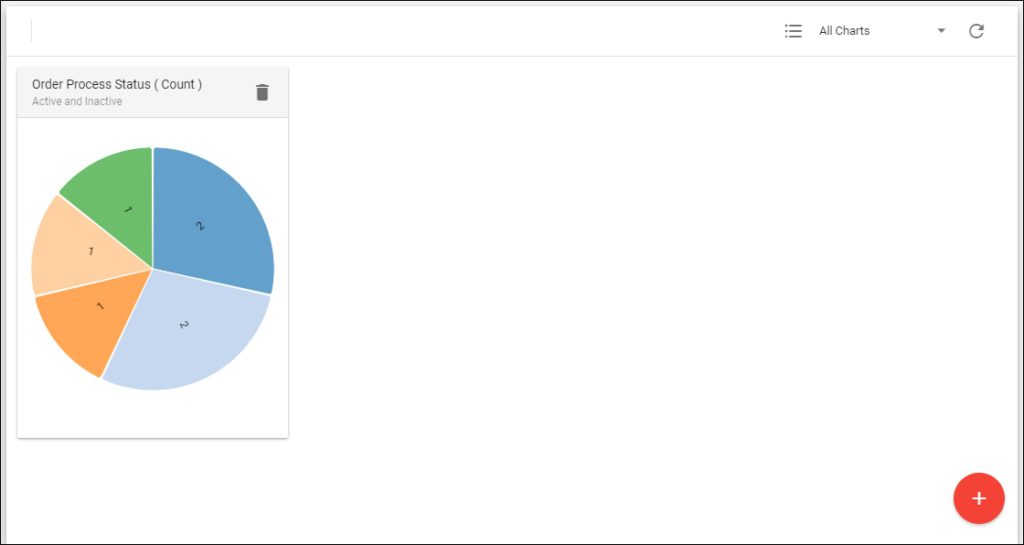
If global charts which are created by a Trasix user are available, the page appears as shown next:
By default, All Charts are displayed. You can view all charts which include the global ones and the ones you have created, global charts only, or your charts only by clicking the arrow next to the charts menu, the following options appear:
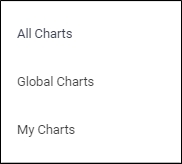
Click the option you want.
You can go back to the list view by clicking ![]() .
.
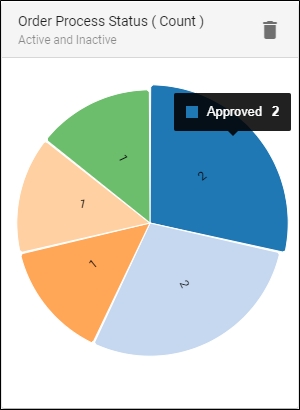
As you hover the mouse over any of the charts sections, its information is displayed as shown in the below example:
You can also create a new chart or delete any of the charts you created as discussed in the coming sections.
Note:
- Global charts can only be created and deleted by a Trasix user.