Charts view
T1 provides the Charts feature which enables you to create charts and analyze your colorways based on certain attributes. These charts can be created based on the count of colorways having a certain attribute or based on the summation of values for a numeric attribute.
To view charts, follow these steps:
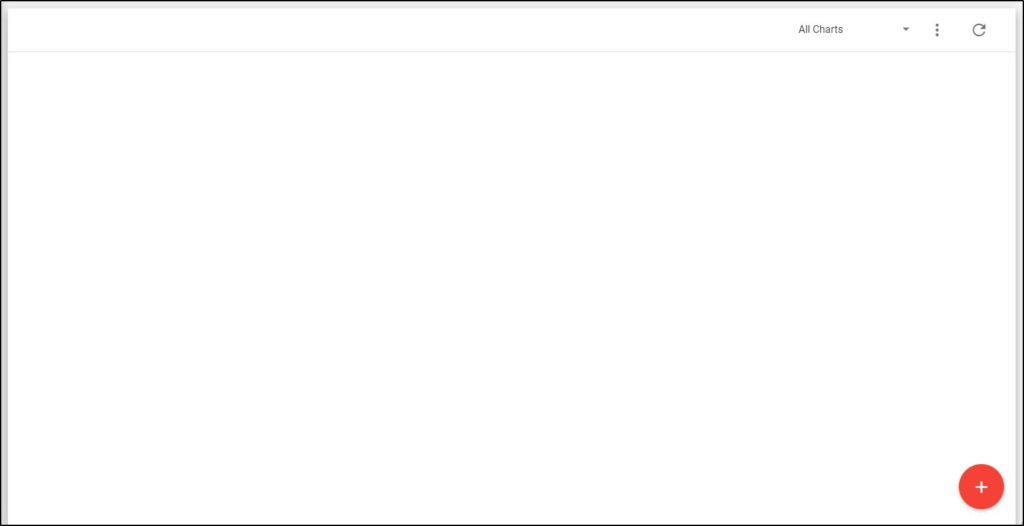
- Go to Colorways module then select Charts view from the Actions menu on top of the list, the following page appears if no charts are available:

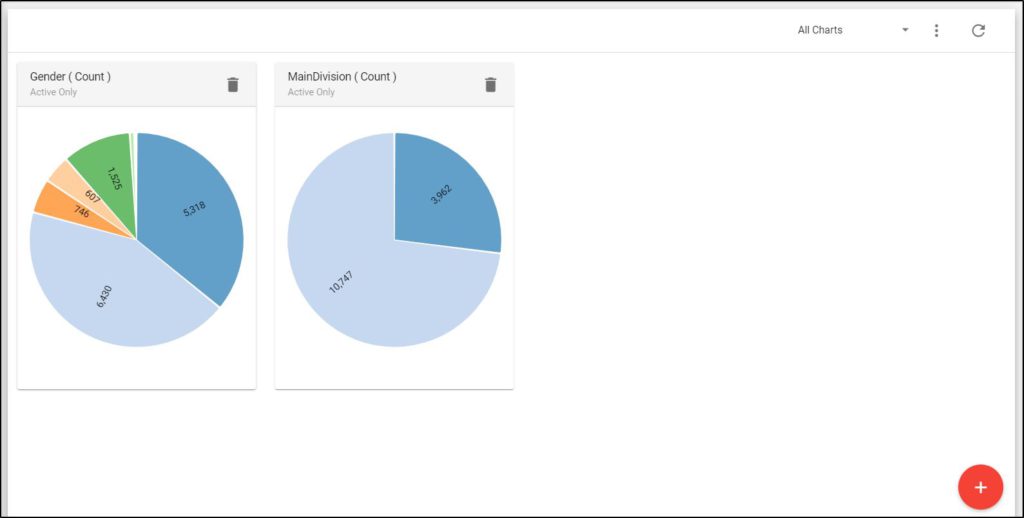
If global charts which are created by a Trasix user are available, the page appears as shown below:

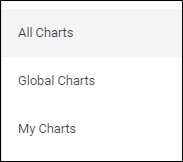
By default, All Charts are displayed. You can view all charts which include the global ones and the ones you have created, global charts only, or your charts only by clicking the arrow next to the charts menu, the following options appear:

- Click the option you want.
You can go back to the list view by selecting List view from the Actions menu. You can also select Image view by selecting the respective option from the Actions menu.
As you hover the mouse over any of the charts sections, its information is displayed.
Note:
- Global charts can only be created and deleted by a Trasix user.
You can also create a new chart or delete any of the charts you created as discussed in the coming sections.