Create chart
To create a chart, follow these steps:
- Click
 then click
  , the following window appears:
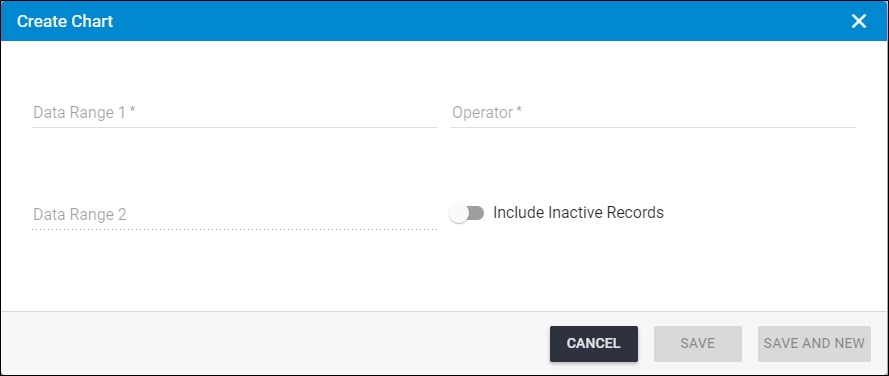
- Enter the attribute according to which you want the chart to be created in the “Data Range 1” field, or click on the field and select the attribute you want,
- Click the “Operator” field and select one of the following operators:
- Count: chart is divided according to the number of articles with the selected attribute. The “Data Range 2” field is disabled.
- Sum: chart is divided according to the selected attribute in “Data Range 1” showing the summation of values of the numeric attribute selected in “Data Range 2”.
- Click the slider button next to Include Inactive Records if you want the inactive articles to be included in the chart,
- Click Save to create the chart, or click Save and New if you want to save the chart and create another one,
The below page shows three examples of charts:
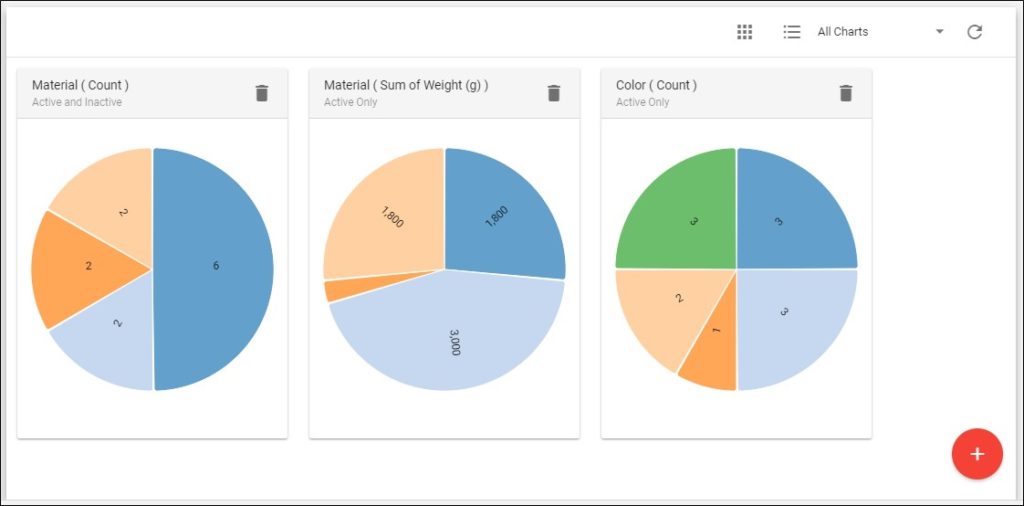
The first chart shows the count of articles according to the material attribute. The second chart is the summation of weights according to the material attribute, and the final is the count of articles according to their color. Please note that the colors of the charts sections are randomly generated.