Create order chart
To create a chart, follow these steps:
- Click
 then click
  , the following window appears:
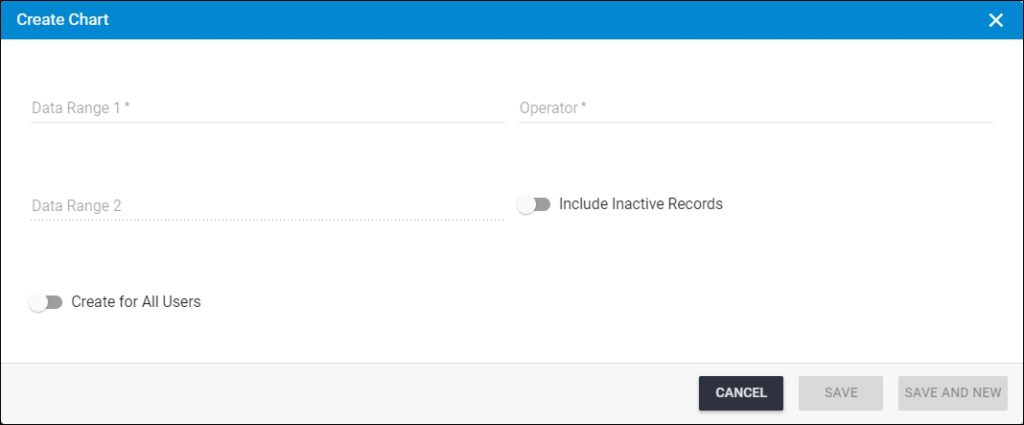
Notes:
- Create for All Users slider button is only enabled for the Trasix user authorized to create global charts. These charts can be accessed by all seller users assigned to the catalog.
- Enter the order field according to which you want the chart to be created in the “Data Range 1” field, or click on the field and select the field you want,
- Click the “Operator” field and select one of the following operators:
- Count: chart is divided according to the number of orders with the selected field. The “Data Range 2” field is disabled.
- Sum: chart is divided according to the field selected in “Data Range 1” showing the summation of values of the numeric field selected in “Data Range 2”.
- Click the slider button next to Include Inactive Records if you want the inactive orders to be included in the chart,
- Click Save to create the chart, or click Save and New if you want to save the chart and create another one,
The below page shows three examples of charts:
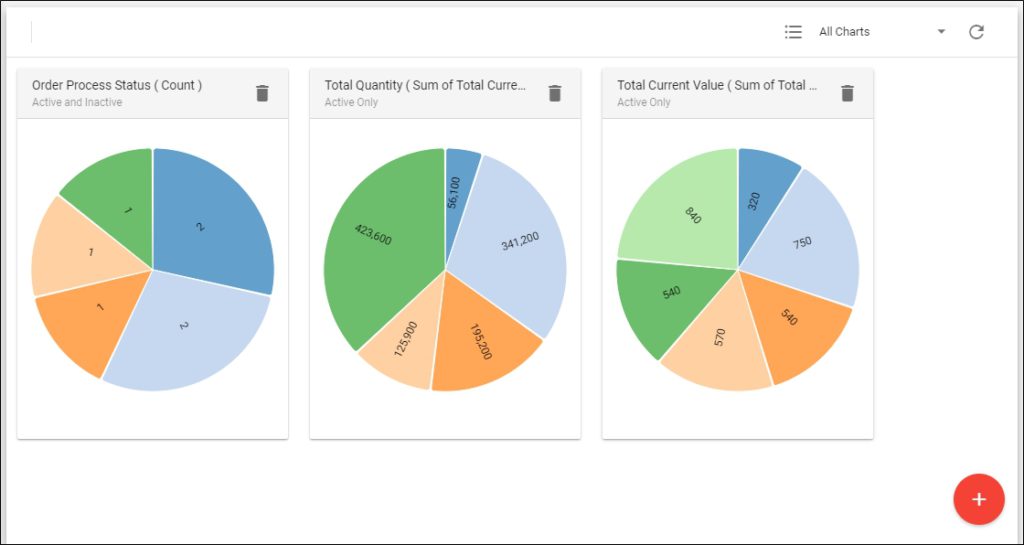
The first chart shows the count of orders according to their processing status. The second chart is the summation of the total current value according to the total quantity of orders, while the third is the summation of total quantity of orders according to the total current value.
Please note that the colors of the charts sections are randomly generated.