Generate report
For line plans, different reports can be generated which are based on article attribute values and targets.
To generate reports for the articles you are viewing on the page, click ![]() , reports are displayed as shown below:
, reports are displayed as shown below:
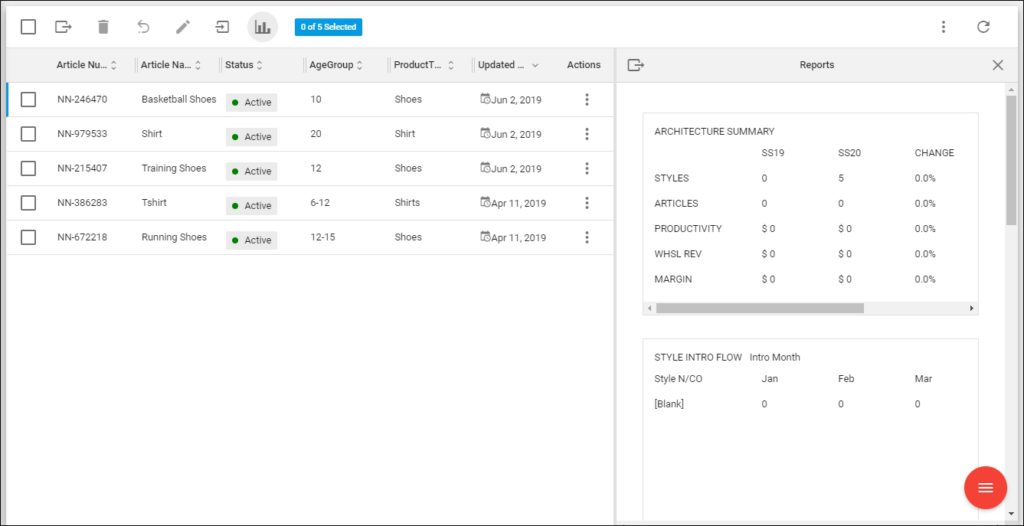
Any changes to the articles displayed are reflected on the reports. You can export those reports and save the Excel file on your PC by clicking the Export button.
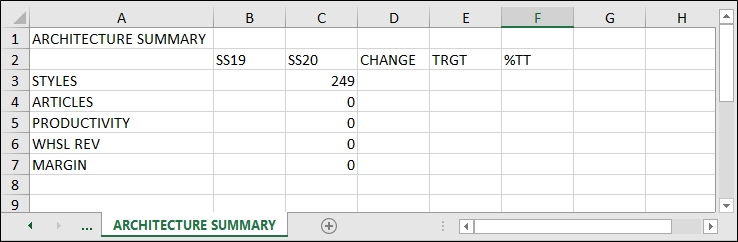
Architecture Summary
Note:
- A configuration is available to manage the seasons for which the report is generated. This configuration is managed by the Trasix Support team.
This report is calculated based on the following logic:
| SS19 | SS20 | CHANGE | TRGT | % TT | |
| STYLES | Inputted from Targets | Count from Line Builder – total rows | (SS20-SS19)/SS19 | Inputted from Targets | (SS20-TRGT)/TRGT |
| ARTICLES | Inputted from Targets | Sum from Line Builder – total of “Total Articles” | (SS20-SS19)/SS19 | Inputted from Targets | (SS20-TRGT)/TRGT |
| PRODUCTIVITY | Inputted from Targets | WHSL REV/ARTICLES | (SS20-SS19)/SS19 | Inputted from Targets | (SS20-TRGT)/TRGT |
| WHSL REV | Inputted from Targets | Sum of “GMP Grade $ (Whsl)” | (SS20-SS19)/SS19 | Inputted from Targets | (SS20-TRGT)/TRGT |
| MARGIN | Inputted from Targets | (Sum of “Margin $ Ext”)/(Sum of “GMP Grade $ (Whsl)” | (SS20-SS19)/SS19 | Inputted from Targets | (SS20-TRGT)/TRGT |
Style Intro Flow
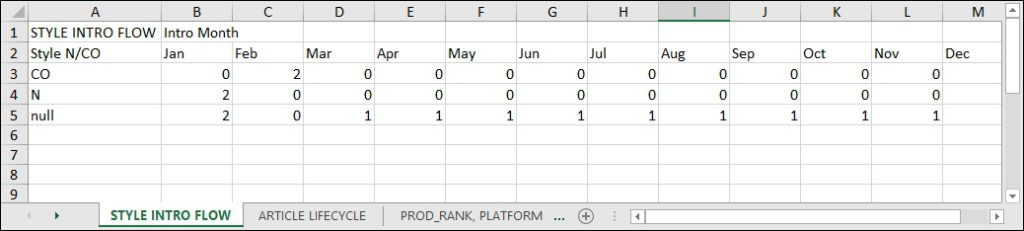
This report is calculated based on the following logic:
- NEW: Count from Line Builder where “Style N/CO” = “NEW” and “Intro Month” = “Jan”
- C/O: Count from Line Builder where “Style N/CO” = “C/O” and “Intro Month” = “Jan”
The logic is the same for all the months.
Article Lifecycle
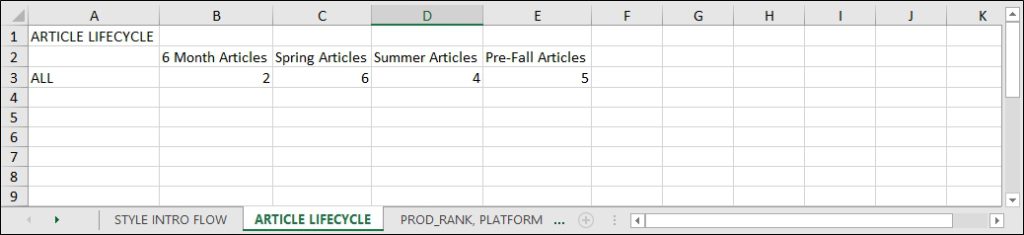
This report is calculated based on the following logic:
- 6 Month Articles: Sum from Line Builder – the total of “6 Month Articles”
- Spring: Sum from Line Builder – the total of “Spring Articles”
- Summer: Sum from Line Builder – the total of “Summer Articles”
- Prefall: Sum from Line Builder – the total of “Pre-Fall Articles”
Product Ranking, Platform, and Subsilhouette Distribution
This report is calculated based on the following logic:
Product ranking for platform #1 and SubSilhouette #1:
- Best: Count of rows within Line Builder that fit criteria (Best, Platform #1, Class #1)
- Better: Count of rows within Line Builder that fit criteria (Better, Platform #1, Class #1)
- Good: Count of rows within Line Builder that fit criteria (Good, Platform #1, Class #1)
Product Segmentation
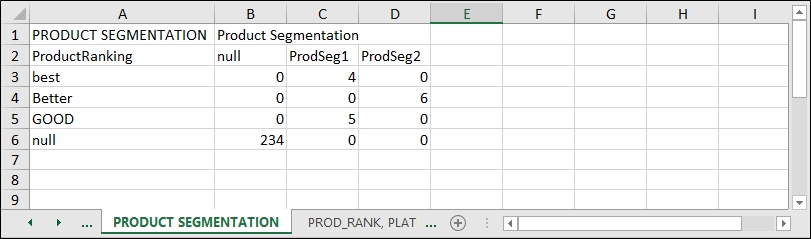
This report is calculated based on the following logic:
Product ranking:
- Best: performance is Count of rows within Line Builder that fit criteria (Best, Performance)
- Better: performance is Count of rows within Line Builder that fit criteria (Better, Performance)
- Good: performance is Count of rows within Line Builder that fit criteria (Good, Performance)
Product Ranking, Platform and Segment Distribution
This report is calculated based on the following logic:
Product ranking for platform #1 under customer segmentation #1:
- Best: Count of rows within Line Builder that fit criteria (Best, Platform #1, Segment #1)
- Better: Count of rows within Line Builder that fit criteria (Better, Platform #1, Segment #1)
- Good: Count of rows within Line Builder that fit criteria (Good, Platform #1, Segment #1)