Slide summary
You can create a summary for articles in different slides by either slide name, attribute, or price value. This summary is represented by charts (i.e. vertical, horizontal, and pie charts). Slide summary attributes and chart types are configured by Trasix Support team.
To create the charts, follow these steps:
- Click Summary, the following window appears:

- Click the folder you want to expand to view its slides, and select the folder(s) and slide(s) you want to include in the summary,
Note:
- By default, the selected slide on the board will be selected when you click Summary.
- Select whether you want to include the dropped articles in the summary,
- Click Generate Report, the following window appears:
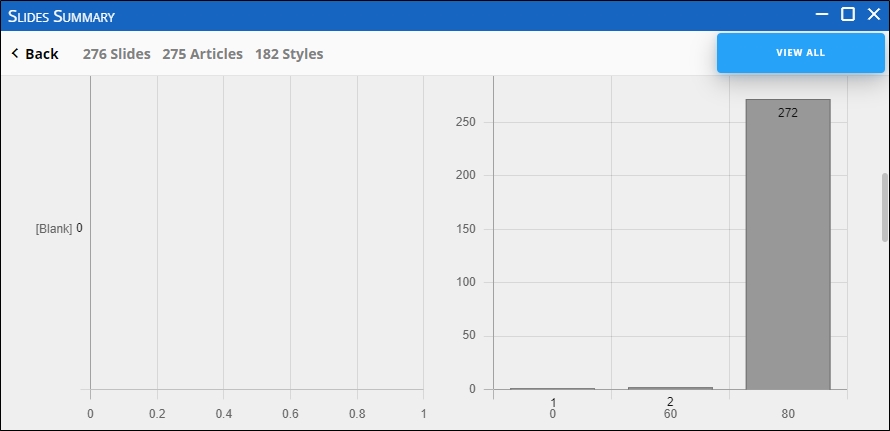
When you hover the mouse over any of the charts’ sections, it shows the total number of articles in that section. You can click View All to view all the articles in all charts. You can group articles by attributes configured to create summary charts. Groups are assorted in ascending or descending order based on the catalog configuration, while articles within each group are configured using a custom sort configured by different attribute values.
You can also use the Filter By menu to select multiple attribute values based on which articles are filtered. The number of slides used to generate the charts is shown and when you hover the mouse over the number, the names of the slides are displayed. Also, the numbers of unique articles and styles are displayed.
- Click the chart section to view its articles as shown below:
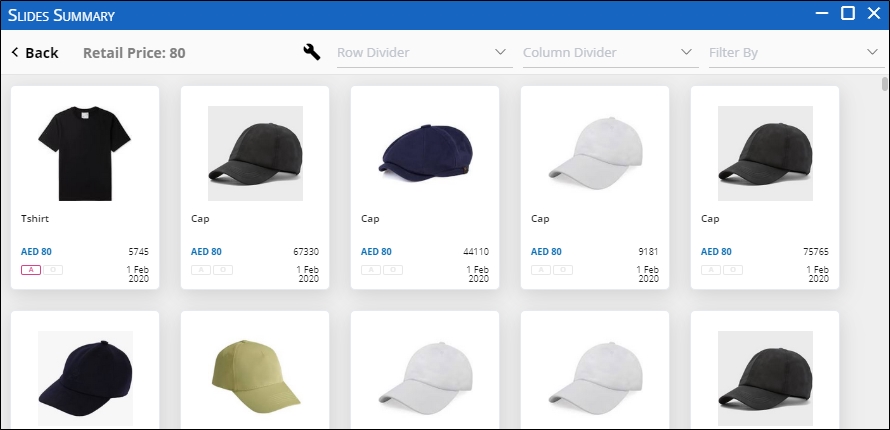
You can group articles by attributes other than the attribute on which the selected chart is created. You can also use the Filter By menu to select multiple attribute values based on which articles are filtered.