Summary charts
To generate charts for forecast values, click Summary charts, charts are displayed as shown in the below example:
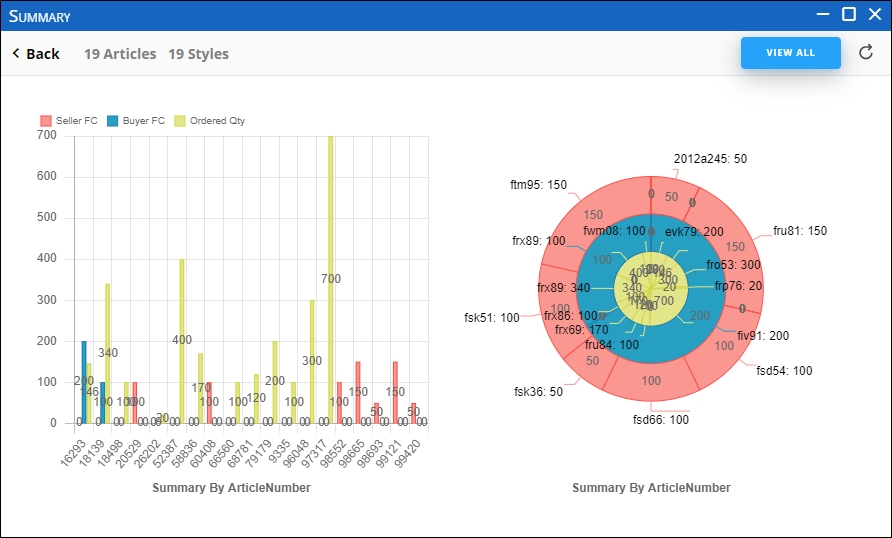
These charts compare the seller forecasts, buyer forecasts and ordered quantities. Articles for each sections can be viewed by clicking the chart section, or clicking View All to display all articles.