Generate reports
You can generate different reports which are based on article attribute values and targets. To do so, click Generate Reports, the following window appears:
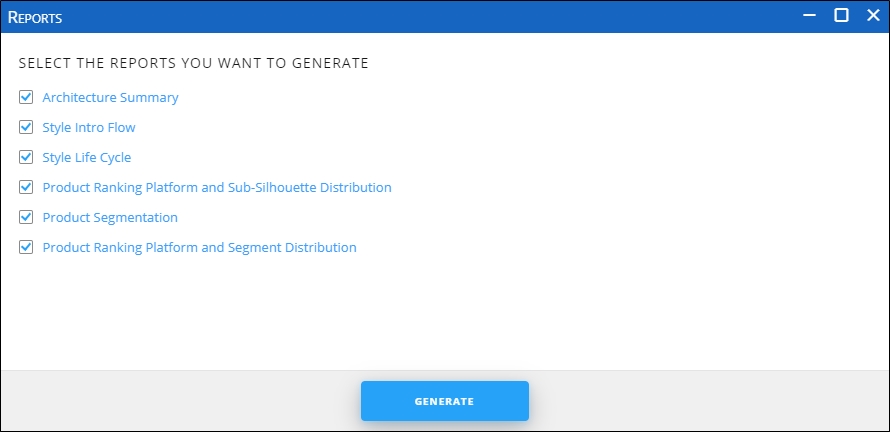
You can deselect any of the reports, if you want then click Generate, the following reports are generated:
Architecture Summary
This report appears as shown in the below example:
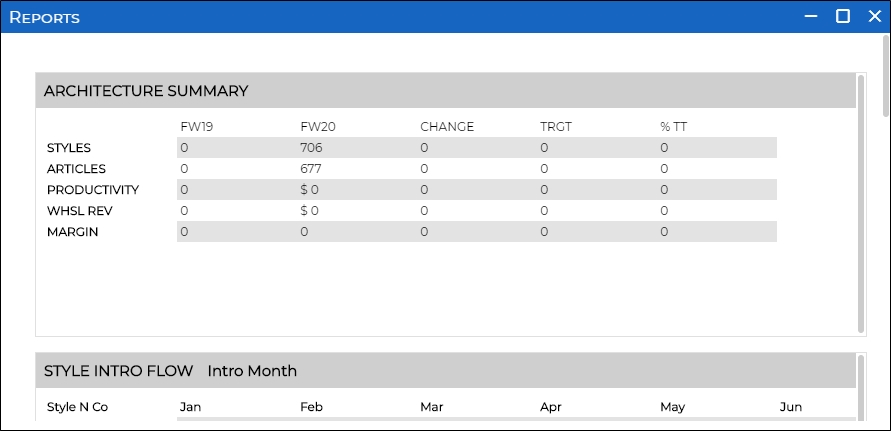
This report is calculated based on the following logic:
| FW19 | FW20 | Change | TRGT | %TT | |
| STYLES | Inputted from Targets | Count from Line Builder – total rows | (FW20-FW19)/FW19 | Inputted from Targets | (FW20-TRGT)/TRGT |
| ARTICLES | Inputted from Targets | Sum from Line Builder – total of “Total Articles” | (FW20-FW19)/FW19 | Inputted from Targets | (FW20-TRGT)/TRGT |
| PRODUCTIVITY | Inputted from Targets | WHSL REV/ARTICLES | (FW20-FW19)/FW19 | Inputted from Targets | (FW20-TRGT)/TRGT |
| WHSL REV | Inputted from Targets | Sum of “GMP Grade $ (Whsl)” | (FW20-FW19)/FW19 | Inputted from Targets | (FW20-TRGT)/TRGT |
| MARGIN | Inputted from Targets | (Sum of “Margin $ Ext”)/(Sum of “GMP Grade $ (Whsl)” | (FW20-FW19)/FW19 | Inputted from Targets | (FW20-TRGT)/TRGT |
Note:
- Values in this report are changed according to the data filtered using the Filter tab.
Style Intro Flow
This report appears as shown in the below example:
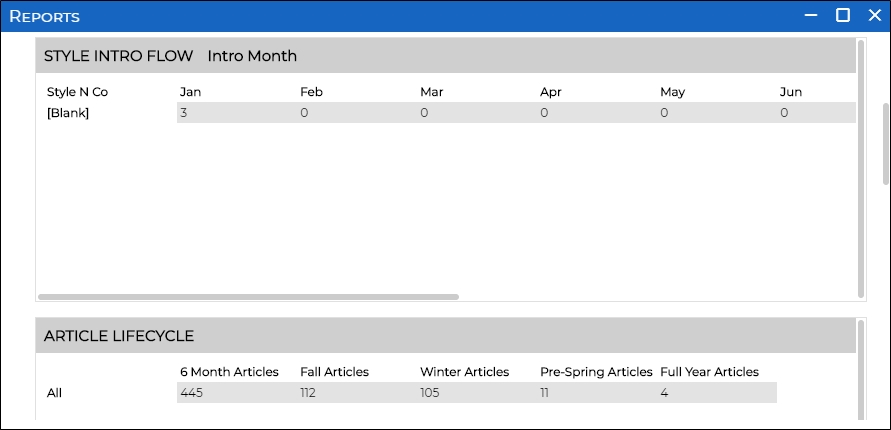
This report is calculated based on the following logic:
- NEW: Count from Line Builder where “Style N/CO” = “NEW” and “Intro Month” = “Jan”
- C/O: Count from Line Builder where “Style N/CO” = “C/O” and “Intro Month” = “Jan”
The logic is the same for all the months.
Article Lifecycle
This report appears as shown in the below example:
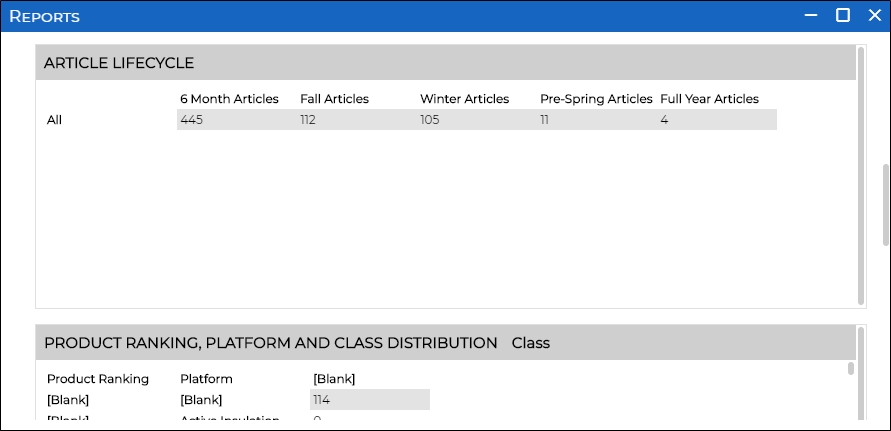
This report is calculated based on the following logic:
- 6 Month Articles: Sum from Line Builder – the total of “6 Month Articles”
- Spring: Sum from Line Builder – the total of “Spring Articles”
- Summer: Sum from Line Builder – the total of “Summer Articles”
- Prefall: Sum from Line Builder – the total of “Pre-Fall Articles”
Product Ranking, Platform, and Subsilhouette Distribution
This report appears as shown in the below example:

This report is calculated based on the following logic:
Product ranking for platform #1 and SubSilhouette #1:
- Best: Count of rows within Line Builder that fit criteria (Best, Platform #1, Class #1)
- Better: Count of rows within Line Builder that fit criteria (Better, Platform #1, Class #1)
- Good: Count of rows within Line Builder that fit criteria (Good, Platform #1, Class #1)
Product Segmentation
This report appears as shown in the below example:
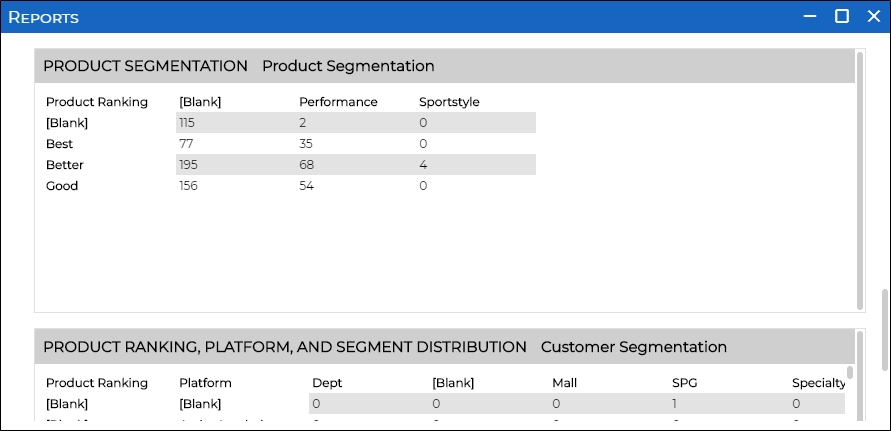
This report is calculated based on the following logic:
Product ranking:
- Best: performance is Count of rows within Line Builder that fit criteria (Best, Performance)
- Better: performance is Count of rows within Line Builder that fit criteria (Better, Performance)
- Good: performance is Count of rows within Line Builder that fit criteria (Good, Performance)
Product Ranking, Platform and Segment Distribution
This report appears as shown in the below example:
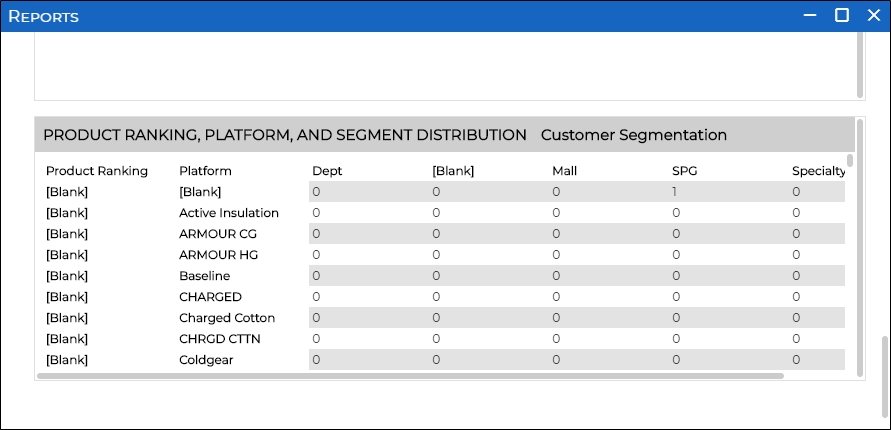
This report is calculated based on the following logic:
Product ranking for platform #1 under customer segmentation #1:
- Best: Count of rows within Line Builder that fit criteria (Best, Platform #1, Segment #1)
- Better: Count of rows within Line Builder that fit criteria (Better, Platform #1, Segment #1)
- Good: Count of rows within Line Builder that fit criteria (Good, Platform #1, Segment #1)